Global drylands cover approximately 41% of the Earth's land area, support nearly 3 billion people, and constitute a vital component of terrestrial ecosystems. Against the backdrop of intensifying global climate change, the ecological and environmental trends in drylands not only relate to regional sustainable development but also profoundly impact the global carbon cycle. In recent years, satellite observations have revealed a significant greening trend in global drylands. The scientific community has largely attributed this phenomenon to the fertilization effect driven by rising atmospheric CO₂ concentrations, while a systematic understanding of the role of human activities has been lacking.
In this context, Professor MA Xuanlong's research group from the College of Earth and Environmental Sciences, Lanzhou University published their latest research findings in the Journal of Remote Sensing, a Science Partner Journal. Through a systematic analysis of global dryland vegetation dynamics from 2001 to 2024, they explicitly identified, for the first time, that human activities—particularly agricultural expansion and intensification—have become the primary driver of vegetation greening in drylands, with their contribution significantly exceeding that of the CO₂ fertilization effect and climate change factors.
By integrating multi-source satellite observations and machine learning methods, the research team found that 29.20% of global drylands exhibited a significant greening trend. Asia contributed the largest share, approximately 983 Tg C of carbon increase, accounting for over half of the total net GPP change in global drylands. Quantifying the relative contributions of various factors through Partial Least Squares Regression analysis revealed that the combined effect size of human activities reached 0.68, far exceeding that of the CO₂ fertilization effect (0.32) and climate factors (0.03).
Notably, the research team compared satellite observations with the latest TRENDYv12 Dynamic Global Vegetation Models and discovered that these state-of-the-art models systematically underestimated the greening rate in drylands and substantially overestimated the contributions of CO₂ and climate factors. This finding highlights the deficiencies in the representation of human activities within current Earth system models and holds significant implications for improving the accuracy of global carbon cycle predictions.
This study not only deepens the understanding of global dryland vegetation dynamics but also provides a scientific basis for refining Earth system models. The results call for increased attention to the impacts of human activities on ecosystems in international climate change assessments and ecological policy formulation, offering crucial scientific support for achieving global sustainable development goals.
Yi Li, a 2025-grade master's student (through the integrated Bachelor-Master program) majoring in Cartography and Geographic Information System at the College of Earth and Environmental Sciences, Lanzhou University, is the first author of the paper. Professor MA Xuanlong is the corresponding author. The research was supported by the National Natural Science Foundation of China (Grants No. 42311540014 and 42171305), the Key Program of the Natural Science Foundation of Gansu Province (Grant No. 25JRRA646), and the Fengyun Application Pioneering Project (Grant No. FY-APP-2024.0302).
Paper Link: https://doi.org/10.34133/remotesensing.0941
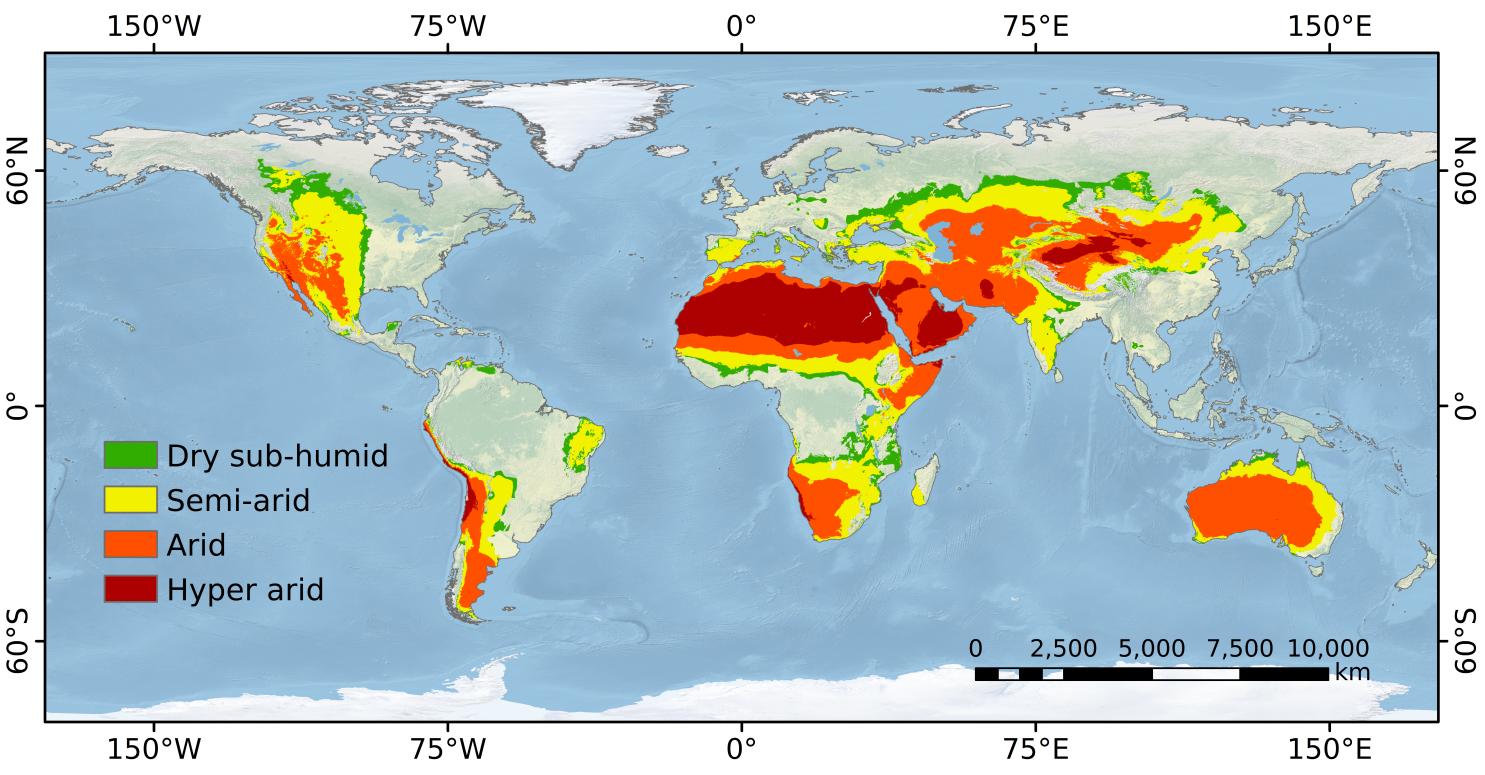
Figure 1. Spatial distribution of global drylands and aridity classification map. Hyper arid: AI between 0-0.03(dark red); Arid: AI between 0.03-0.2 (orange); Semi-arid: AI between 0.2-0.5 (yellow); Dry sub-humid: AI between 0.5-0.65 (green).
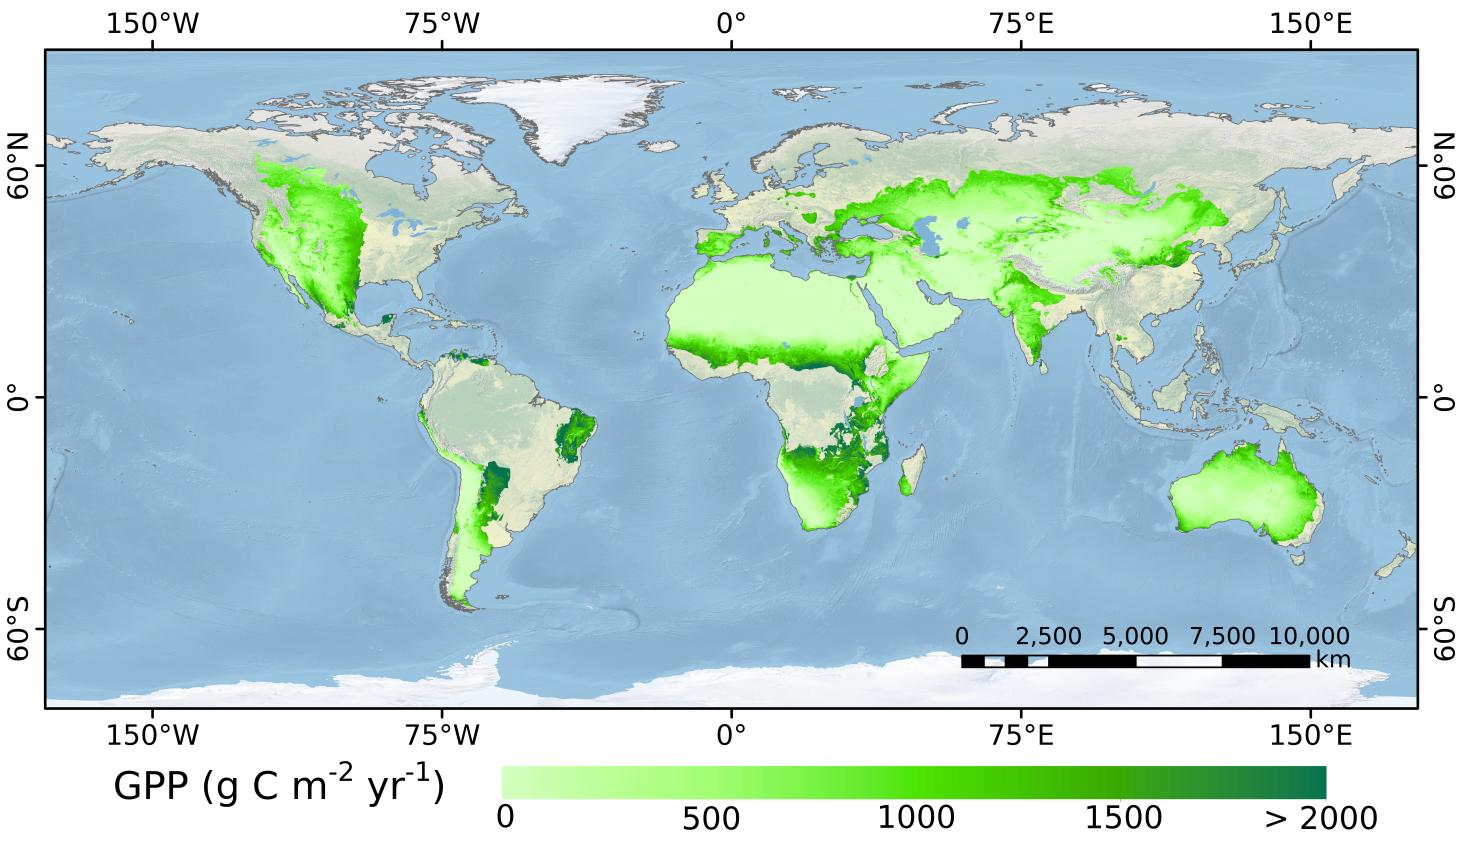
Figure 2. Spatial patterns of mean annual gross primary productivity (GPP) across global drylands (2001-2024).
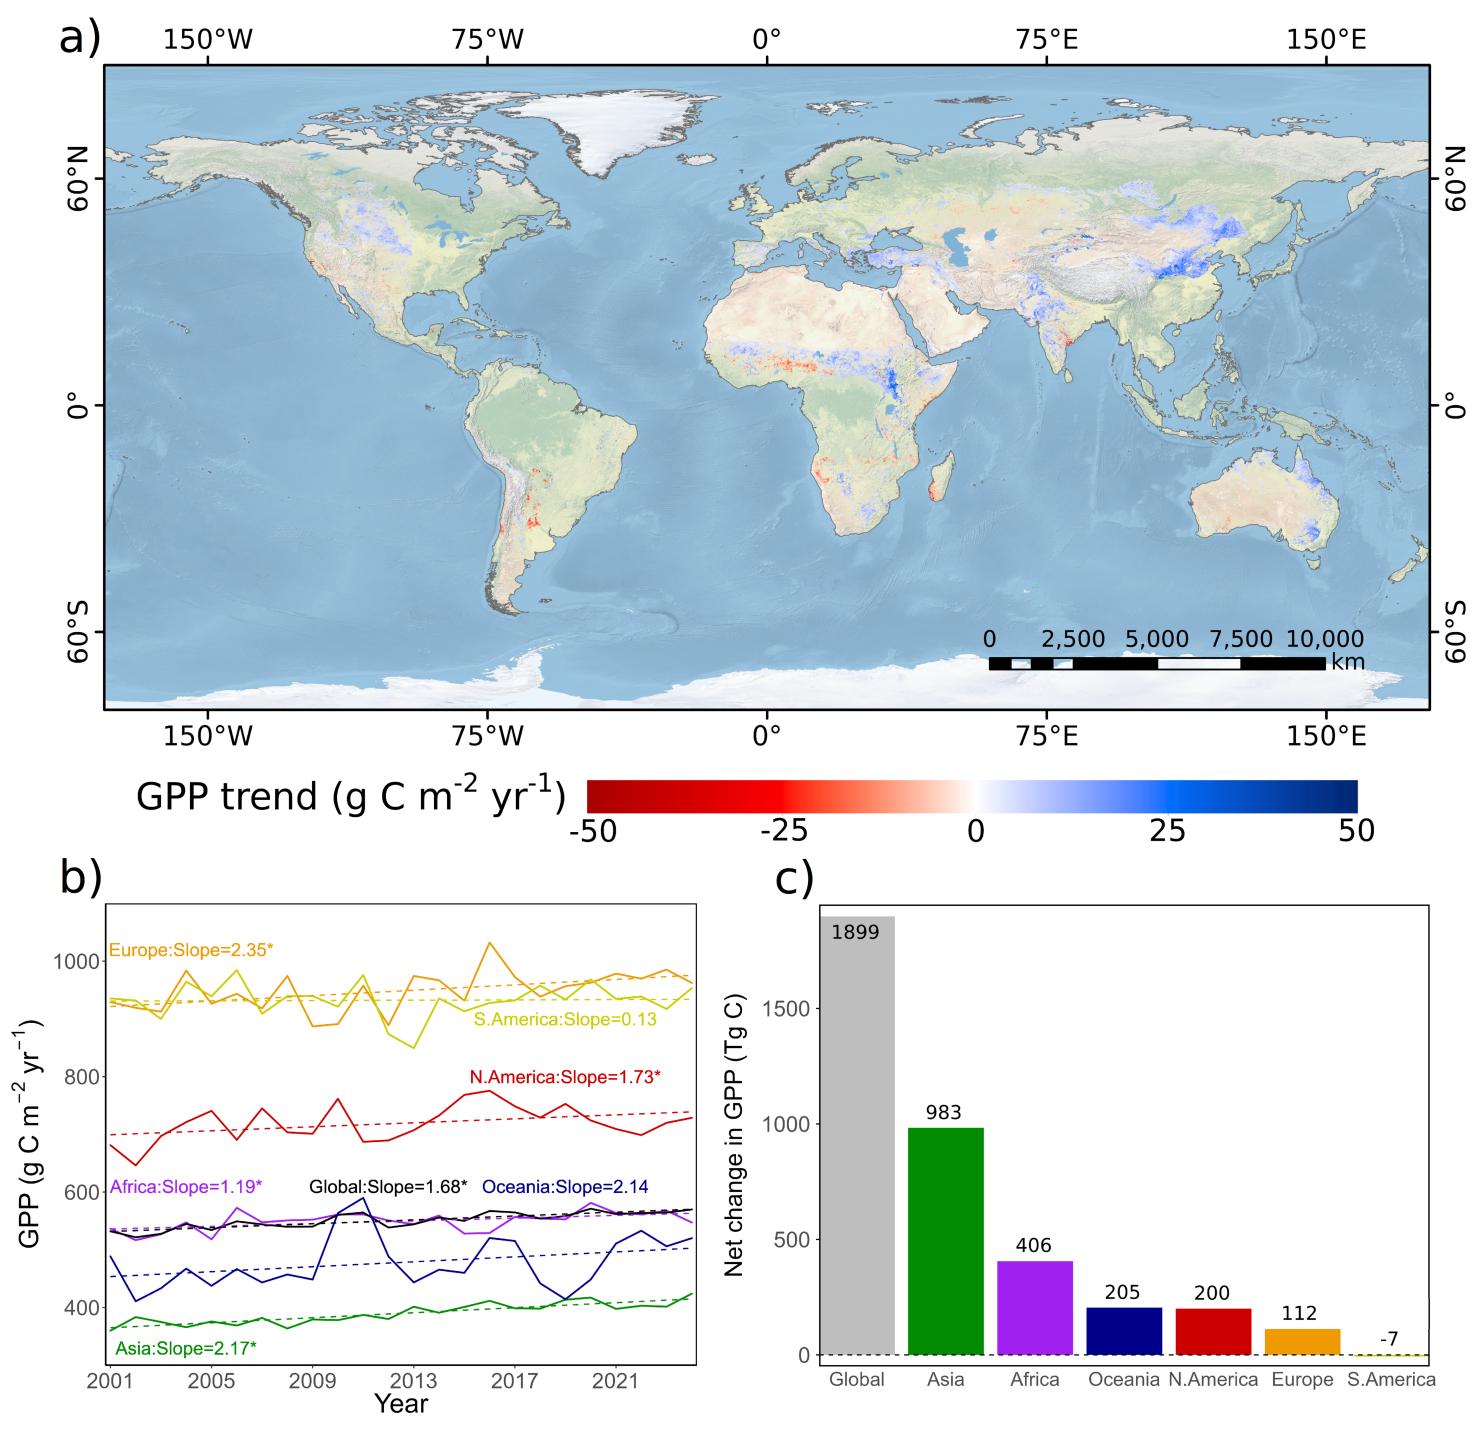
Figure 3. Spatiotemporal patterns of Gross Primary Productivity (GPP) in global drylands (2001-2024). a) Spatial pattern of GPP trend in global drylands. Statistically significant trends (Mann–Kendall test, p < 0.1) are color-coded. Blue representing an increasing trend and red representing a decreasing trend. b) Annual GPP trend across different regions, with an asterisk (*) indicating p < 0.1. c) GPP net change across different regions. The net change is calculated based on the trends of pixels that have passed the significance test (p < 0.1).
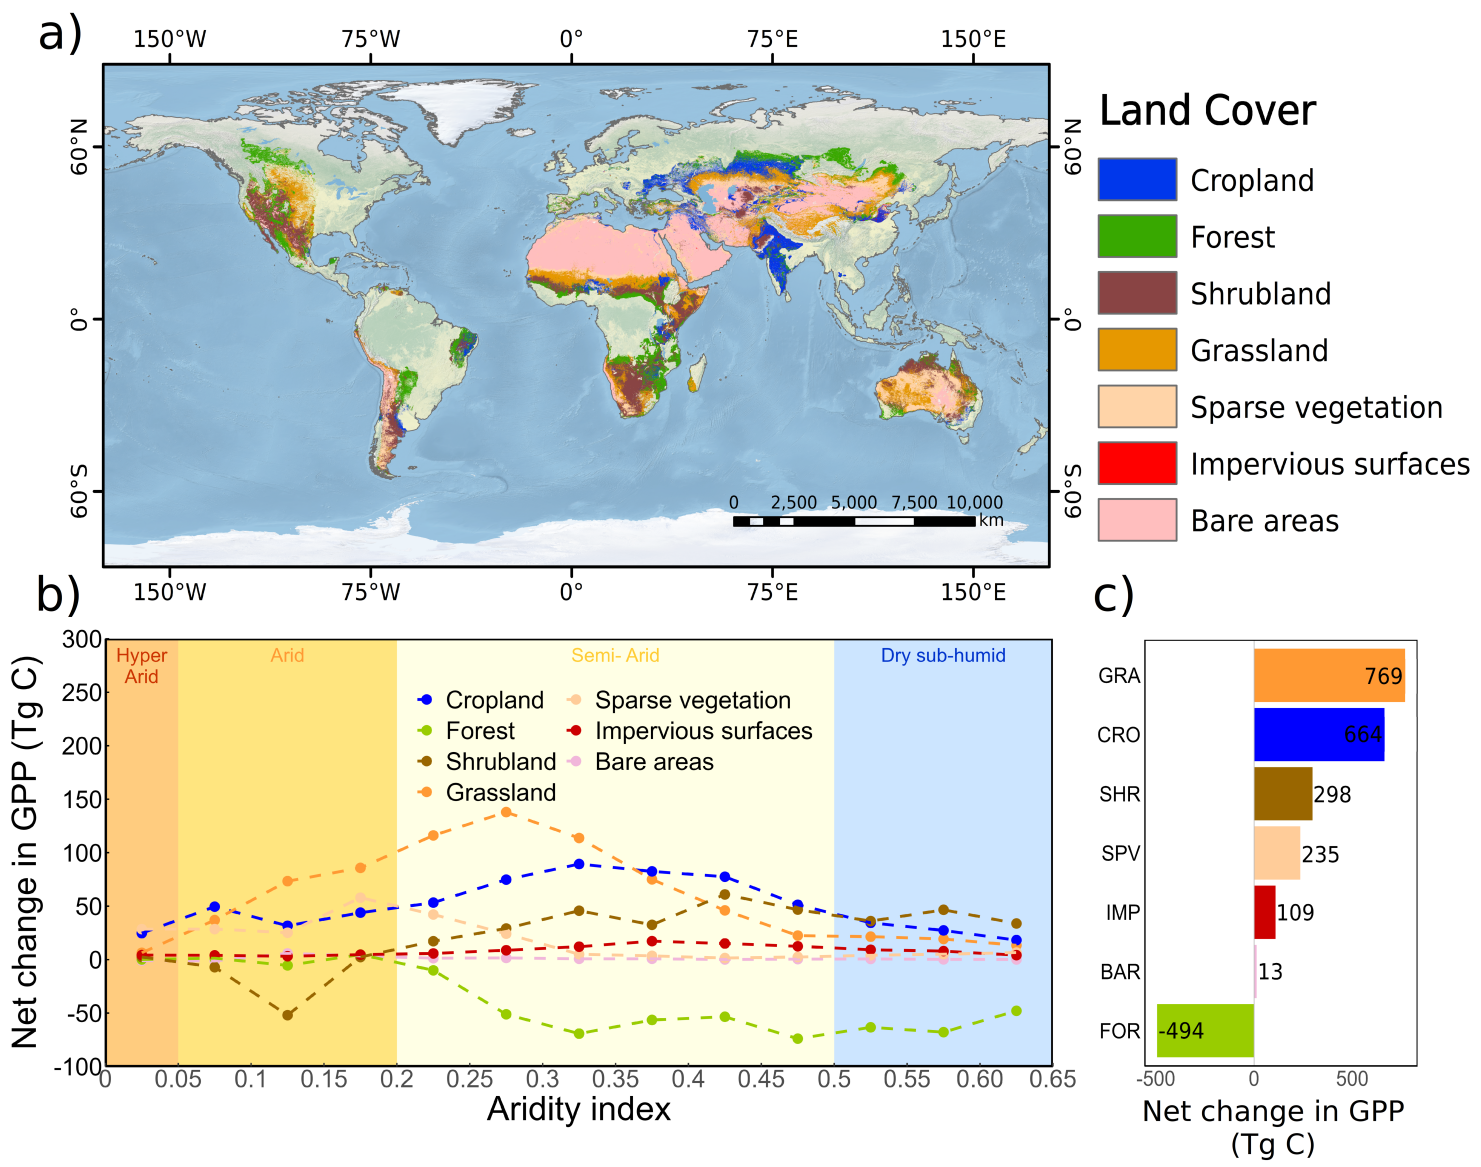
Figure 4. Differential responses of Gross Primary Productivity (GPP) among ecosystem types and along aridity gradient in global drylands. a) Spatial distribution map of major ecosystem types in 2020. b) GPP net change of different ecosystem types along the aridity gradient. c) GPP net change of different ecosystem types in global drylands. The net change is calculated as the total GPP in 2024 minus the total GPP in 2021.
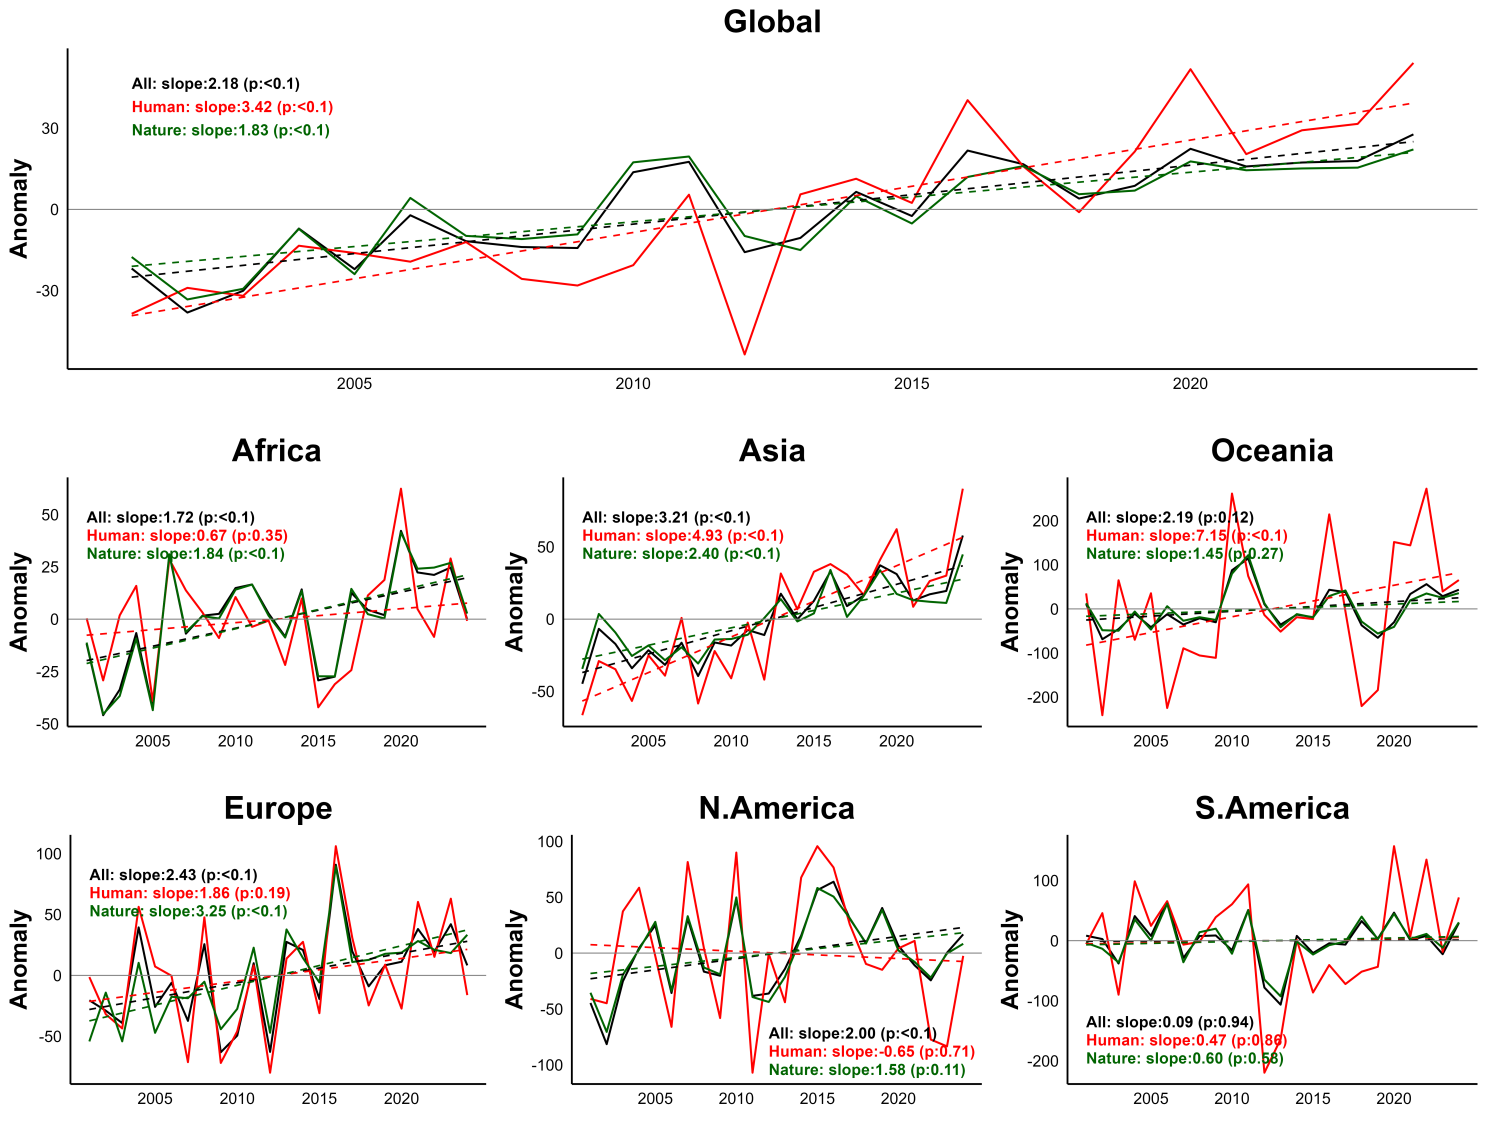
Figure 5. Temporal variations in annual mean GPP across different regions and ecosystem types. Black: All ecosystems; Red: Human ecosystems (Cropland + Impervious surfaces); Green: Natural ecosystems (Forest +Shrubland + Grassland + Sparse vegetation + Bare areas). The slope values of regression lines and corresponding statistical significance (p-values) for each ecosystem type are annotated in their respective coordinate systems.
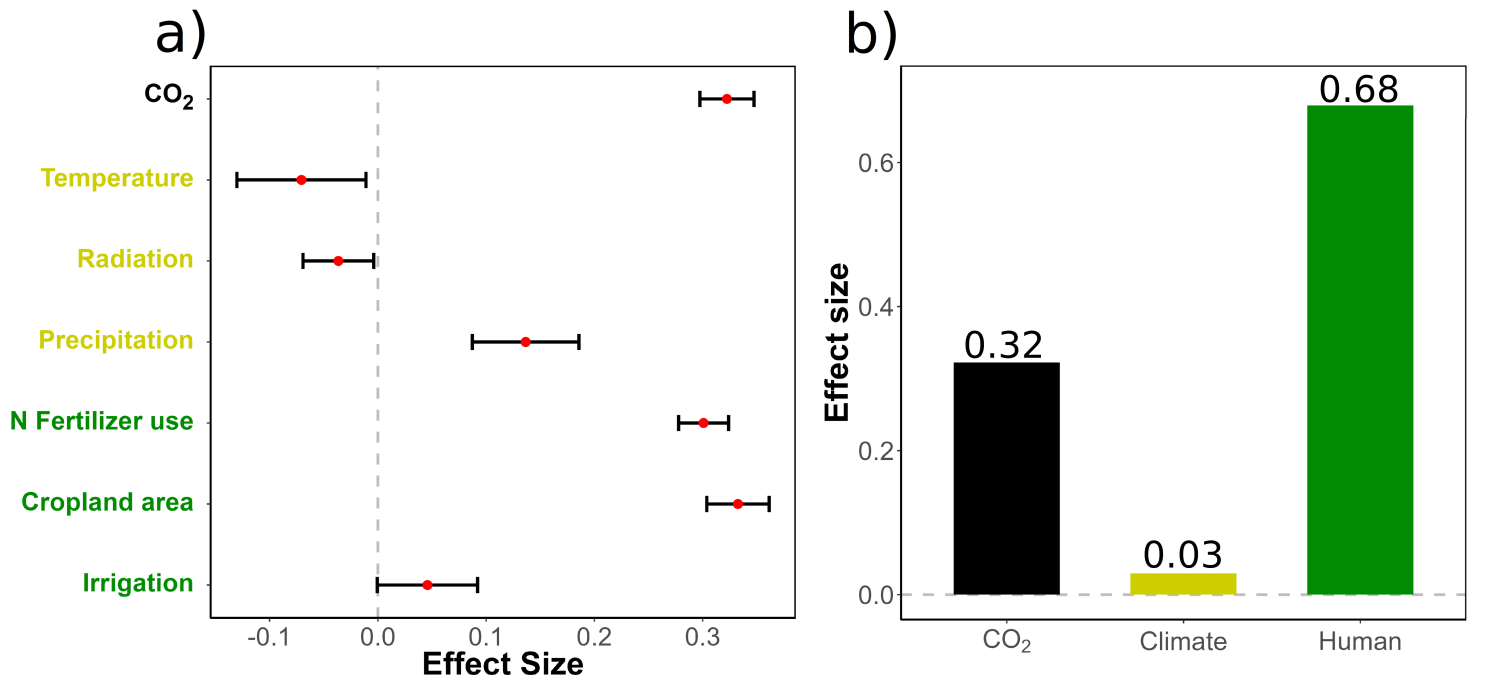
Figure 6. Attribution of global dryland greening to multiple natural and anthropogenic factors. a) In regions with significant GPP increases (p < 0.1), effect size of cropland area, N fertilizer use, Precipitation, Radiation, Temperature and CO2 on GPP derived from a Partial Least Squares Regression model; b) effect size grouped into three broad categories represent the major forces of global dryland greening. The red dots represent the effect sizes of the variables, while the black lines indicate their corresponding error ranges.
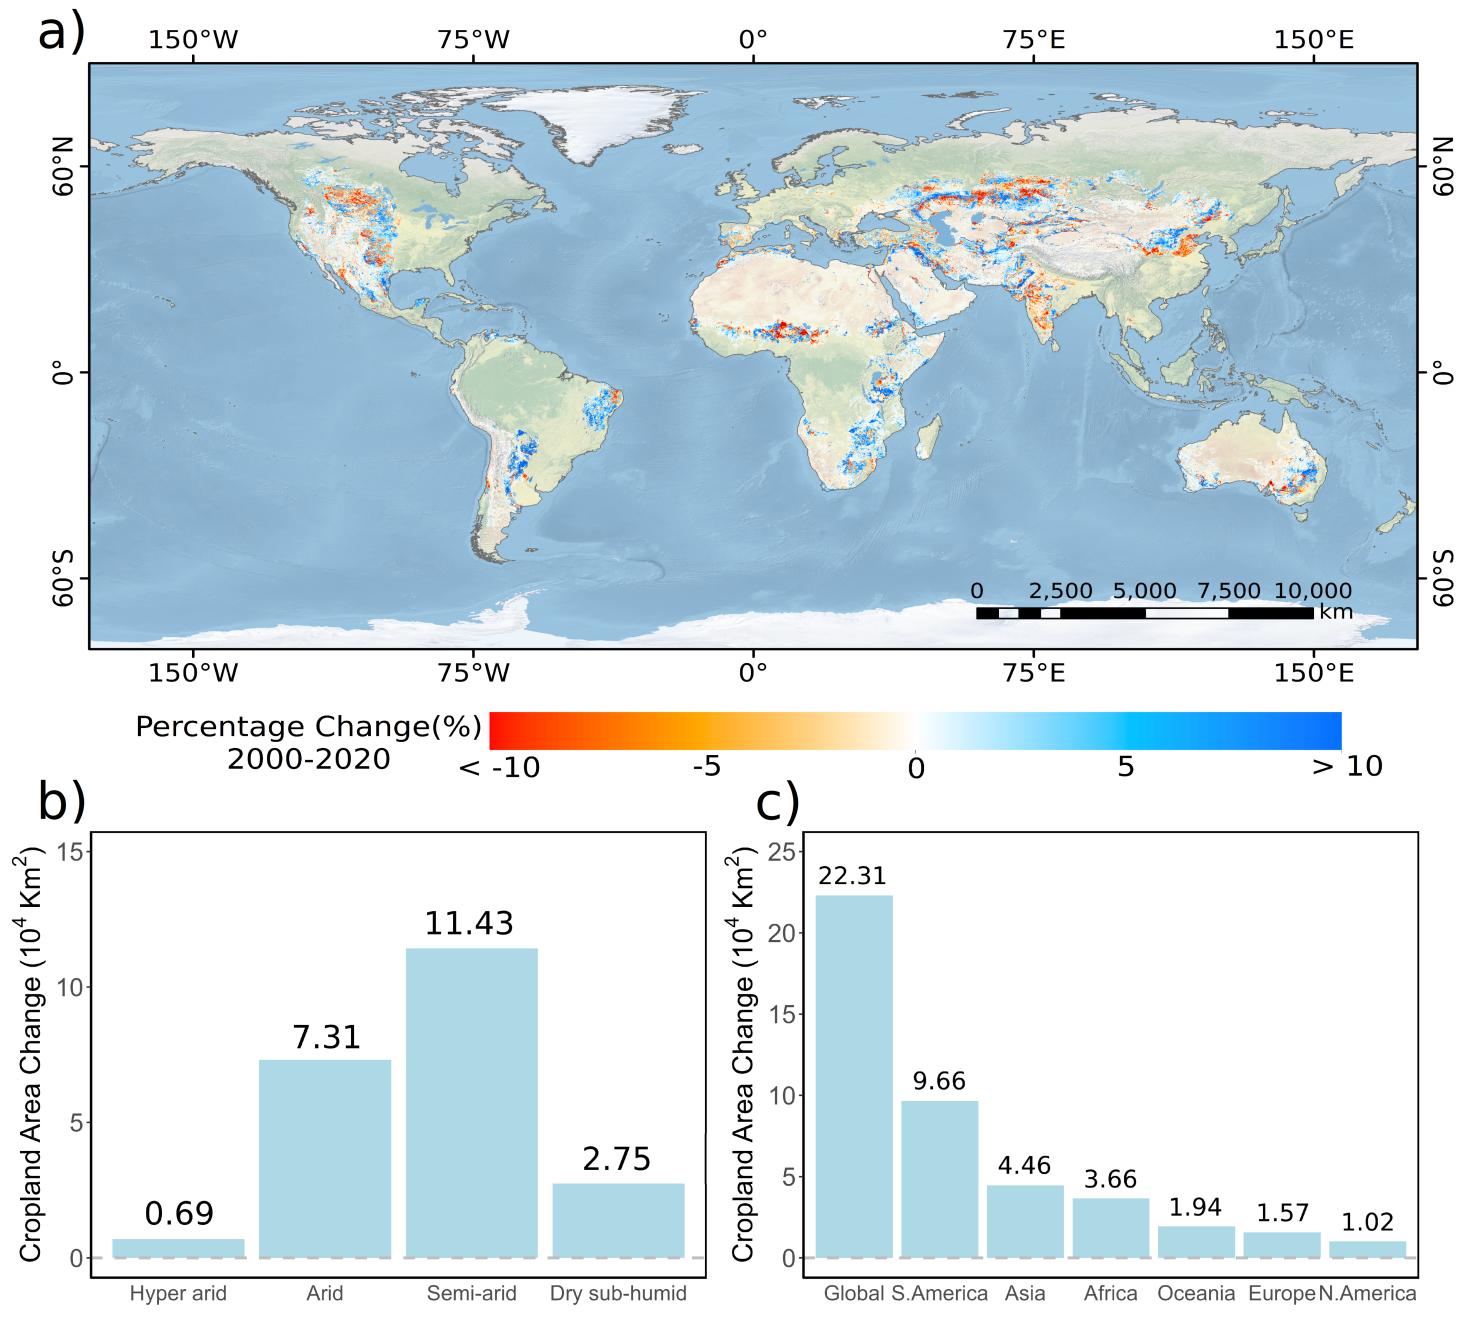
Figure 7. Global dryland cropland change. a) Spatial distribution of cropland percentage change (2020 minus2000): Blue areas indicate cropland expansion, while red areas represent cropland degradation. The heatmap illustrates GPP trends across different aridity levels and cropland percentage intervals, with blue denoting GPP increase and red indicating GPP decrease. b) Changes in cropland area under different aridity levels, with change values labeled on the map; c) Changes in cropland area globally and in different regions, with change values labeled on the map.
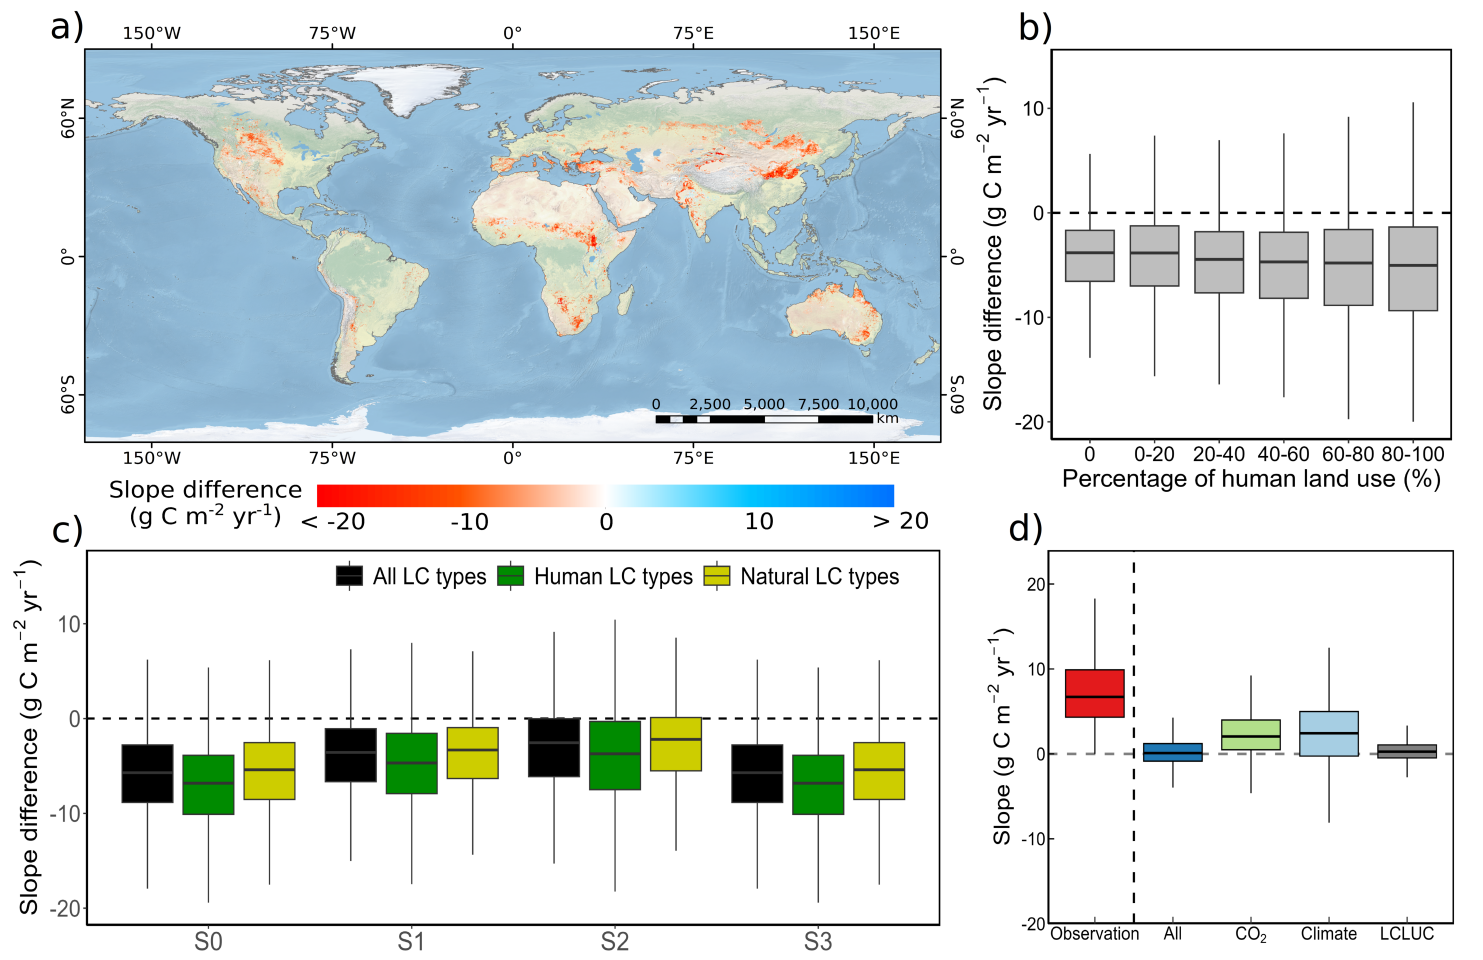
Figure 8. Analysis of slope differences between TRENDY model GPP data and satellite observed GPP data in regions with significant GPP increases (p < 0.1). a) Spatial distribution map of slope differences: Use the GPP slope from TRENDY Multi-Model Ensemble Mean (MMEM, S3 scenario) (2001-2022) minus the GPP slope from eLUE (2001-2022); b) Slope differences (TRENDY - Observations) under different area percentage of human land use (Cropland + Impervious surfaces); c) Slope differences (TRENDY -Observations) under different simulation scenarios: S0: No simulation factors considered; S1: CO2; S2: CO2 +climate; S3: CO2 + climate + LCLUC (Land Cover and Land Use Change). Human LC types: Cropland +Impervious surfaces; Natural LC types: Forest + Shrubland + Grassland + Sparse vegetation + Bare areas; d) In regions with significant GPP increases (p < 0.1), comparison of GPP slope driven by different factors between TRENDY and Observations.
